China’s stock markets are often described as “big” and “complex” (which is true, but not especially helpful). The part that matters for investors is simpler: what stock indices exist, what they measure, how they’re built, and why they move the way they do. If you already have basic market knowledge, the next step is understanding the machinery behind index numbers—especially in a market where policy, trading rules, and sector leadership can change faster than your morning coffee plan.
This article explains China’s major stock indices in practical terms. It breaks down how the indices work, what’s inside them, how they’re used by traders and funds, and what risks come with index investing in China. You’ll also get a clearer picture of the role of policy events, the structure between Shanghai and Shenzhen, and the practical implications for anyone tracking performance, valuation, or global comparisons.
What a Stock Index Measures (and Why China’s Indices Behave Differently)
A stock index is usually described as a benchmark, but that word gets used loosely. In practice, an index is a rules-based statistical summary of a selected set of stocks. The index calculation typically reflects market capitalization weighting, price changes, or a combination, depending on the specific index methodology. The goal is that, when the included stocks move, the index number moves in a way that represents the portion of the market you’re trying to track.
China’s indices share the usual features you’d expect—index constituents, rebalancing schedules, corporate action adjustments, and a published methodology. The “different” part comes from a few market realities that can affect how indices reflect economic momentum:
1) Market segmentation and access changes: Mainland markets operate under a set of trading rules distinct from many other countries. Programs like Stock Connect affect who can buy what, when liquidity shows up, and how quickly price discovery happens in certain names.
2) Policy and sector leadership: When policy aims shift—whether about technology, property, commodities, or consumer credit—it often shows up first in large-cap, heavily followed sectors. Since many indices in China are heavily influenced by large capitalization stocks, policy-driven shifts can move indices more sharply than in markets where leadership rotates more smoothly.
3) Index construction and share-class effects: Indices may use free-float adjustments, include or exclude certain share classes, and apply specific eligibility criteria. China has had years of evolution in listing rules and reform of market access; those changes can alter the “shape” of index membership.
4) Valuation and earnings variation: China’s market leadership can change with the business cycle and with regulatory tone. Indices that have heavy exposure to sectors with distinct valuation dynamics can therefore behave differently in bull and bear periods.
So yes, indices are benchmarks. But in China, they’re also a kind of “policy mood ring” for the market segments they cover—because the composition and weighting determine whose news counts the most for the index number.
China’s Major Mainland Equity Index Families: Shanghai, Shenzhen, and Composite
When people say “China’s stock market,” they usually mean the mainland exchanges: Shanghai Stock Exchange (SSE) and Shenzhen Stock Exchange (SZSE). The most watched indices commonly split along these lines, then get combined into broader composite measures. The practical reason is straightforward: investors need benchmarks for each trading venue and for the total mainland market.
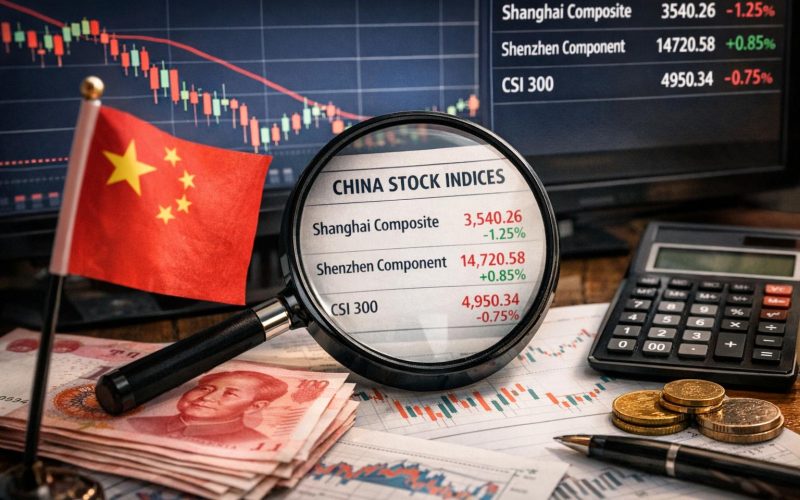
Among the best-known index families are the Shanghai Composite (SSE Composite Index), the Shenzhen Component, and the CSI 300 (a broader, large-and-mid-cap index). You also see composite measures like the CSI All Share and exchange-specific indexes that target style or sector exposures.
Here’s the useful mental model: think in terms of (a) exchange-based broad coverage, (b) large-cap and tradable coverage for investability, and (c) specialization for style, sector, or volatility strategies.
Exchange-based broad indices
Exchange-based indices are the ones most commonly referenced in news coverage. The SSE Composite Index is designed to represent the performance of stocks listed on SSE. The Shenzhen Component Index does something similar for SZSE but often uses a constituent selection scheme that focuses on a certain subset of prominent stocks. Broad, exchange-focused indices are important for understanding “what the market is doing today,” but they aren’t always the best measure for investable large-cap exposure.
Large-and-mid-cap mainstream benchmarks
For many portfolio managers and index funds, the workhorse tends to be an index like CSI 300, which covers stocks across both Shanghai and Shenzhen. The “why” is boring but important: large-and-mid-cap indices tend to be more liquid, more investable, and easier for funds to replicate with fewer trading frictions.
Composite broad coverage for data and comparison
For broader representation, you’ll see indices that include more segments of the market, such as CSI All Share-type measures. These help when you want to understand whether performance is driven only by a narrow set of large names or whether a wider slice of listed equities is participating.
In short: China’s index landscape has a “map” logic—exchange coverage, investable large-cap coverage, and broad coverage for market-wide breadth. Once you keep that map in your head, the rest becomes less confusing and more like normal market plumbing.
CSI 300: The Mainland Benchmark Most People Actually Trade
CSI 300 is one of the most widely referenced benchmarks for mainland equities, particularly for investment products and performance comparisons. It covers 300 stocks from both Shanghai and Shenzhen. Because it’s focused on large and liquid names relative to very small caps, it often behaves as a “core” reference point for China equity exposure.
The practical consequence is that when CSI 300 moves, it’s usually because investors are reacting to information that affects major companies—earnings expectations, policy signals that influence top listed sectors, and shifts in sentiment around risk assets. In news terms, CSI 300 often tracks the part of the market where institutional attention is heaviest.
Constituent selection and investability
Index providers generally aim for index constituents that are investable, liquid enough for tracking, and representative of the larger market segments. Even when the index methodology is technical, the implications show up in the portfolio: CSI 300 tends to include names with higher float-adjusted market capitalization, and it excludes smaller, less liquid stocks that can make replication expensive or inaccurate.
This matters if you’re comparing CSI 300 to exchange-wide indices. Exchange-wide indices may include a broader set of stocks, including smaller caps that can move strongly on specific company news. CSI 300 smooths that somewhat by focusing selection on the investable universe.
Sector and factor exposure
China’s leadership sectors have changed across years—technology, industrials, financials, energy transition themes, consumer-related sectors, and more. Since CSI 300 uses market capitalization-based weighting (typically with float adjustments), the index weights reflect what investors value most among large caps at any given time.
So if you’re bullish on, say, consumer demand, you usually care not just that “consumer stocks exist,” but whether consumer stocks have enough weight in CSI 300 to significantly influence returns. On the flip side, if you “own” CSI 300 exposure through a fund or derivative, you’re implicitly taking exposure to the sectors that currently dominate that index’s weight structure.
How it’s used in funds and derivatives
CSI 300’s role extends beyond being a number in the newspaper. It’s used as an underlying benchmark for index funds and investment products, and it’s commonly referenced for performance measurement. Traders also pay attention because index-linked products can concentrate flows into the constituent basket, affecting risk premia and short-term volatility.
In plain English: CSI 300 is frequently the segment of the market where “the grown-ups with big orders” want exposure. When that segment moves, many other pieces of the market start moving too—sometimes because of fundamentals, sometimes because of positioning.
Shanghai Composite Index: Exchange Breadth and Sentiment
The SSE Composite Index is widely recognized as a broad indicator of stocks listed on the Shanghai exchange. It’s the one you’ll see in daily market commentary if the headline needs something that sounds official and comprehensive.
Because it includes a wide array of Shanghai-listed stocks, it can reflect a mix of large caps and smaller names, though the exact contribution depends on weighting rules and the composition at the time. That mixture means the index can be influenced by both broad market sentiment and idiosyncratic movements in Shanghai-listed companies.
What makes Shanghai representation different
Shanghai listing history and the composition of large names give the SSE Composite its own character. If you compare it to CSI 300, you’re not comparing “same thing” with different names; you’re comparing different composition rules. SSE Composite captures Shanghai-listed share performance, while CSI 300 targets a cross-exchange investable subset.
So when you hear that “Shanghai is outperforming,” what you should interpret is that the Shanghai-listed constituents (as defined by the index rules) have outperformed relative to either the broader market or the other exchange.
Sentiment and breadth signals
Broad exchange indices can be useful for tracking whether performance is driven by a narrow set of mega-caps or by wider market participation. If exchange indices move while the large-cap benchmark lags, you might be seeing leadership in smaller caps. If the opposite happens, leadership likely sits with the largest companies.
That’s a subtle but practical point for investors who track breadth. Even if you don’t plan to trade every day, understanding whether a move is “concentrated” or “widespread” helps avoid false confidence.
Index level comparisons and pitfalls
Comparing index levels across time is always tricky, because indices are constructed from constituent weights, shares outstanding assumptions, and corporate action adjustments. When you add to that China’s ongoing market modernization, it becomes easy to misread chart moves as “pure market momentum” when composition and eligibility criteria have shifted.
For analysis, focus on total return concepts and methodology consistency rather than treating raw index levels as if they’re perfectly comparable from year to year.
Shenzhen Component Index: Prominent SZSE Names and Leadership Shifts
The Shenzhen Component Index is a prominent benchmark for stocks listed on SZSE. Like many component-style indices, it often places emphasis on a selected group of significant stocks rather than including every eligible name. That selection focus tends to make the index responsive to leadership changes in Shenzhen—especially when Shenzhen-listed growth and innovation-oriented sectors pull attention.
For many investors, the Shenzhen benchmark matters because Shenzhen often represents a different slice of China’s listed equity market. The index can therefore show different momentum patterns compared with Shanghai-heavy indices.
Why a component index can move differently
Because a component index usually relies on selection and weighting rules, it can react differently to small-cap rallies, sector rotations, or single-name surges. A broad index that includes many constituents may show a smoother movement. A component index can show sharper changes if a few large-weight names shift significantly.
This doesn’t mean it’s “bad”—just that you should interpret it correctly. A component index is closer to a curated basket of notable stocks than to a full exchange snapshot.
Sector rotation and factor sensitivity
Shenzhen has often been associated (in public perception at least) with growth-oriented and innovation-related themes. When investor sentiment shifts toward those areas, Shenzhen-related indices can outperform. When the market prefers defensives or when regulation affects certain segments, Shenzhen leadership can lag.
The main lesson: if you’re tracking both Shanghai and Shenzhen indices, you’re watching sector and factor preferences evolve. The indices are not just “prices,” they’re also a mirror of what the market is currently betting on.
Using it alongside composite benchmarks
One practical approach is to compare Shenzhen Component movement with CSI 300 or the SSE Composite. If Shenzhen outperforms both, you may be seeing leadership in Shenzhen-weighted sectors. If Shenzhen lags while CSI 300 holds up, you may be witnessing investor preference for large-cap stability rather than growth experimentation.
That sort of cross-index check is more useful than it sounds, because it forces you to separate “China market is up” from “the portion I’m actually exposed to is improving.”
CSI All Share and Broader Market Coverage: When You Care About Breadth
The CSI All Share-type index concept is built for a different purpose than “headline” indices. Instead of representing only the largest stocks or only one exchange, it aims to cover a wider portion of the market. That broader coverage makes it a useful reference when you care about whether gains are spreading across many companies rather than concentrating in a tight group.
For investors, breadth matters because concentrated rallies often mean higher vulnerability. If the rally depends on a small set of index heavyweights, any shift in sentiment for those names can pull the overall index down quickly. Breadth-oriented indices can help you spot whether the market’s strength has broader participation.
How wider coverage changes interpretation
Wider index coverage can include companies with different liquidity profiles, sector exposures, and business cycle sensitivity. That means the index may pick up movements in mid-cap and small-cap segments that exchange-wide composites might obscure through their weighting scheme—or that large-cap benchmarks may ignore entirely.
In China, where liquidity and sector leadership can shift in response to macro and policy signals, breadth can tell you whether the market’s rally is “real demand” or just concentrated positioning.
Tradeoffs: investability versus representativeness
Broader indices are more representative of the market’s full quoted universe, but they can be harder to replicate in practice. Index funds and derivatives often prefer large-and-liquid baskets because tracking a broader set of smaller constituents increases turnover and trading costs.
So when you use a broad benchmark in analysis, treat it as a measurement tool first. If it becomes a trading benchmark for an investable product, then you need to examine the product’s replication method and constituent coverage rules.
Common analytical use cases
Analysts often compare breadth indicators to large-cap benchmarks to estimate whether the market’s advance is supported across different capitalization ranges. If breadth broadens while large-cap remains stable, you might expect less fragility. If breadth shrinks while large-cap rises, you may be seeing a concentrated rally where risk increases.
It’s not a crystal ball, but it beats watching one line on a chart and calling it a day.
Sector and Style Indices in China: Beyond the Headline Numbers
Mainstream indices like CSI 300 or SSE Composite are broad measures. But investors frequently need more targeted benchmarks: sector indices, factor indices (value, growth, momentum, volatility-style measures), and sometimes custom thematic indices. China has developed a range of these to match investor demand for structured exposure.
These indices are relevant because China investors and global investors alike often want targeted exposure to policy-influenced themes—technology manufacturing, clean energy, semiconductors, consumer services, financials, and more. The headline indices can be too blunt for that purpose.
Sector indices and policy sensitivity
Sector indices usually reflect the performance of companies in a defined industry classification. In China, sector performance can be heavily influenced by:
• regulatory tone and compliance requirements
• government procurement or subsidized demand
• industrial policy priorities
• credit conditions affecting downstream demand
When these pressures change, sector indices react quickly, sometimes more than broad indices. That’s because broad indices may dilute sector-specific effects across many industries, while a sector index isolates them.
Style indices: value, growth, momentum, and quality
Style indices apply a screening methodology that targets characteristics like valuation metrics (value), earnings growth (growth), price trend (momentum), and sometimes profitability or balance-sheet strength (quality). In China, style can shift rapidly because corporate profitability cycles and valuation regimes evolve.
If you’re comparing style indices to a broad benchmark, make sure you understand that style indices may concentrate risk in certain sectors. Growth indices, for example, often end up with more technology exposure, depending on classification and constituent eligibility.
Index volatility and risk management
Some indices focus on volatility and risk control. Low-volatility styles can behave differently during stress periods, not just because of “defensive stocks,” but because rules reweight holdings based on volatility measures.
That affects tracking behavior. A volatility-controlled index might underperform in a smooth rally but hold up better during shocks. You’re essentially trading a different return profile, even if the index name sounds “safer.”
How Chinese Stock Indices Are Calculated: Weighting, Rebalancing, and Adjustments
Index calculation is where the details start to matter. Two indices can look similar on a chart, yet produce different outcomes because their construction rules differ—sometimes by a lot. Understanding the basics of how major indices are calculated helps you interpret moves with less guesswork.
At a high level, most widely used equity indices are calculated using a form of market capitalization weighting. But the mechanism often depends on whether the index uses full market cap or free-float adjusted market cap. Free float is an attempt to exclude shares that are not available for trading (for example, shares held by locked-in strategic stakeholders).
Weighting: market cap and free-float adjustments
If a stock has a large market cap and a high free-float percentage, it will usually have a higher weight in a cap-weighted index. Changes in share eligibility, lock-up releases, or corporate actions can therefore change index weights even if the stock price stays still.
This is one reason two indices can diverge: one may include a stock earlier or apply float adjustments differently.
Rebalancing and reconstitution schedules
Indices do not update constituents continuously in a chaotic way. They follow schedules for:
• rebalancing weights
• reconstitution when eligibility changes
• deletions and additions based on qualification rules
In China, these schedules can interact with periods of reform, new listings, delistings, and changes in market access. When a reconstitution date approaches, demand for index-relevant stocks can increase temporarily due to predictable flow patterns.
Corporate action adjustments (the boring part that saves your charts)
Index providers adjust index levels for corporate actions like dividends, stock splits, rights issues, and similar events. If you’re comparing an index against a price-only chart, you might see differences because price-only charts ignore dividends, while total-return concepts include them. Even if you are not doing complex modeling, it’s helpful to remember that index numbers are adjusted for actions, not purely driven by intraday trading.
Also, index changes can look like “market moves” if you ignore methodology. A stock’s removal from an index can affect the index level even if the removed stock was previously a major component.
For investors, the practical takeaway is simple: when you see a surprising jump in an index, check whether there was a rebalancing or reconstitution event. It’s usually less mystical than it looks.
Trading and Investing with China Indices: Funds, ETFs, and Derivatives
Indices matter because they are used as underlying benchmarks. That’s where the practical world begins: index funds, exchange-traded products, and derivatives let investors turn “index performance” into an investable return stream. In China, the use of indices is influenced by market structure and the availability of products to different investor categories.
Even if you’re not trading derivatives, the effect of index-based investing is real. When funds track a benchmark, they create buying and selling pressure on the underlying constituent basket. That pressure can influence liquidity and short-term price behavior around rebalancing dates.
Index funds and ETFs: tracking and tracking error
Index funds and ETFs aim to replicate the index performance. In practice, they don’t match perfectly due to:
• transaction costs
• cash drag
• dividend and settlement timing differences
• imperfect replication methods (sampling versus full replication)
Tracking error is the measurable difference between a product and its benchmark. In China, tracking error can also reflect differences in liquidity across stocks and changes in constituent availability.
Derivatives: index futures and options mechanics
Derivatives linked to major indices are used for hedging, speculation, and risk management. Futures can be used to gain exposure without buying all constituent stocks. Options can define payoff profiles for expected volatility or downside protection.
Derivatives also affect trading behavior. If many market participants hedge using index futures, price responses to new information—especially at the margin—can become more pronounced. This can make index-level moves feel “faster” than the underlying stock news alone.
A practical investor use case
Imagine a portfolio manager in London or Singapore who wants China equity exposure but doesn’t want to pick individual stocks. They choose an index-based product tied to CSI 300 or a comparable benchmark. The manager still has decisions to make—currency hedging, product costs, tracking error tolerance—but they outsource constituent selection to the index methodology.
The risk isn’t the index itself; it’s the assumptions embedded in the index. If the index is concentrated in sectors affected by policy shifts, then “index exposure” becomes “policy exposure” whether the investor asked for it or not. The index is tidy bookkeeping; reality is messier.
Policy, Market Access, and Liquidity: What Drives Index Movements in China
In most markets, indices move because investors change their views on expected returns and risk. In China, those expectations are influenced by additional forces: policy announcements, credit conditions, market access frameworks, and liquidity shifts. Since indexes aggregate many stocks, changes in these macro and regulatory drivers show up as index-level moves.
To make this concrete, think about how a policy shift in China often works. It can influence corporate earnings expectations, investor sentiment, and the cost of capital. Those changes show up first in high-liquidity, large-cap stocks because that’s where trading volume clusters and where large investors allocate risk.
Market access frameworks: domestic versus external flows
Index performance can be affected by changes in investor access. Programs that connect international and domestic trading channels can influence which investors can buy which stocks. When demand arrives in a predictable way, liquidity improves and price discovery can sharpen. When access tightens or risk appetite shifts, the reverse can happen.
The main point: index moves aren’t always “inside the company.” Sometimes they’re “inside the trading permission structure.”
Liquidity and volatility effects
Liquidity is not static. It can improve when volatility is low and investors are calm, then evaporate when risk increases. Because many indices are cap-weighted, liquidity tied to large-cap names often keeps those names trading even when the rest of the market gets thin.
That can create a situation where the index holds up better than the broader market, or where the index exaggerates a leadership effect because only a subset of stocks trades actively.
Macro variables: rates, credit, and property-related transmission
China’s macro drivers include interest rate expectations, credit availability, and economic activity linked to property and construction cycles. Even if you don’t model these variables directly, recognize the transmission pathway: macro conditions influence earnings expectations and sometimes sector risk premia. Because sectors like financials, property-related supply chains, and consumer demand are often heavily represented in major Chinese indices, macro changes can translate quickly into index-level returns.
So, when you track indices, don’t just track prices. Track the environment that those prices are responding to. The index is the scoreboard; policy and macro are the referees.
Risks of Index Investing in China: Concentration, Policy Shifts, and Methodology Changes
Index investing tends to feel “safe” because it diversifies across many stocks. That’s true, but it can also hide specific risks. China indices can be diversified in count but concentrated in weight, especially in cap-weighted benchmarks where a small number of large names dominate.
There are also risks specific to index construction and management, such as changes to eligibility rules and reconstitution schedules. Add policy-driven sector rotation, and the risk profile of an “index” can change faster than expected.
Concentration risk: diversification in name only
Even if CSI 300 contains 300 stocks, the top holdings can account for a large share of the index’s movement. If those top holdings become policy-sensitive—due to regulation, procurement changes, or demand shifts—the index’s performance can look more like a single-sector bet than a broad market play.
Policy risk and sector tilt
Policy risk matters because indices can tilt toward sectors that policy influences strongly. When policy supports a sector, the index can benefit quickly. When policy changes direction, the same index can quickly give back gains.
This isn’t unique to China, but the pace and intensity of regulation can be higher. That means index investors should treat policy shifts as part of portfolio risk management, not as “news noise.”
Methodology changes and data interpretation
Index providers can change constituent rules, weighting approaches, or free-float assumptions. Those changes can affect backtests and comparisons. If you’re analyzing performance over several years, methodology consistency becomes important.
Also, different index variants may exist (price index versus total return variants, different rebalancing methods, and different classification updates). Confusion here is common among investors who just want “the China index.” The solution is to anchor analysis to the exact index and variant.
Product risk: tracking and execution
An index is one thing. The fund or ETF tracking it is another. Replication method, liquidity of constituents, withholding taxes, and operational constraints can cause the product to deviate from the theoretical index performance.
So, when you use indices for investment decisions, examine the actual product mechanics—not just the benchmark name.
How to Evaluate China Indices: A Practical Checklist for Real Decisions
You don’t need a finance PhD to evaluate indices. You do need a practical process so you know what you’re looking at and what assumptions are embedded in the numbers. Here’s a structured approach that fits real workflows.
1) Match the index to your exposure goal
If your goal is broad mainland exposure, a composite benchmark is appropriate. If you want large-cap liquidity and index product compatibility, CSI 300-style indices tend to fit better. If you want breadth across capitalization ranges, broad coverage indices may be more suitable.
This step prevents a common mistake: using the wrong benchmark and then wondering why results don’t match your expectations.
2) Check sector and top-holding concentration
Before treating an index like a neutral market barometer, examine its sector exposures and weight distribution. In China, sector and policy tilt can change. If an index is dominated by sectors that are currently volatile or policy-sensitive, your “market exposure” might behave like a “sector bet.”
3) Be clear on index variant: price versus total return
If you’re comparing to a portfolio that receives dividends, you need an index comparison that reflects total return behavior. Price indices can mislead for income-focused evaluation.
4) Account for index reconstitution timing
Rebalancing and reconstitution can create predictable trading flows. If you’re analyzing short-term performance around specific dates, include those events in your timeline. Otherwise you might attribute index moves to market fundamentals that are simply index mechanics.
5) Compare index performance with and without breadth
If breadth indicators (broad-market indices) diverge from large-cap benchmarks, interpret that as information about participation. Concentrated leadership can increase risk. This doesn’t tell you the direction, but it tells you the texture of the move.
This checklist won’t give you perfect timing, but it helps you make decisions with fewer blind spots.
Comparing China Indices to Global Benchmarks: Currency, Risk, and Index Composition Effects
When global investors compare China indices with, say, US or Europe indices, they often focus on charts and headline returns. That’s fine for quick context, but global comparison requires attention to currency effects, sector composition, and risk premia differences. The index number itself doesn’t adjust for the fact that investors in different currency zones face different hedging costs and macro risks.
Currency impact on investor returns
If a return is measured in local currency, translating it to another currency can produce different results. China’s currency dynamics can matter, especially in periods when risk appetite changes. So, when you compare indices, separate “market performance” from “currency translation” if possible.
Sector composition differences
US indices have a different sector and factor mix than Chinese indices. Even within “tech,” the composition differs. China indices can have higher weight in policy-sensitive sectors or in domestic credit transmission channels. As a result, comparing the index performance as if they represent identical “risk assets” can be misleading.
Valuation regime and earnings cycle timing
Indices reflect the valuation and earnings expectations of their constituents. If China’s earnings cycle is at a different stage than the US, index comparisons across time periods can look odd. Also, changes in discount rates (interest rate expectations abroad and in China) can move markets differently even if company fundamentals are stable.
So for global benchmarking, compare using consistent windows, be mindful of currency, and don’t assume that “index up 10%” means the same kind of return driver everywhere.
Common Misunderstandings About Stock Indices in China
Index discussions often go off the rails due to a handful of recurring misconceptions. They aren’t malicious—more like “people are busy and charts are persuasive.” Still, these mistakes can lead to wrong conclusions.
Misunderstanding 1: “The index is the market”
Index performance represents the chosen constituents and weighting rules. If the index covers large caps only, it’s not the entire market. If the index covers broad segments but is cap-weighted, it still might reflect only a part of market activity.
Misunderstanding 2: “Outperformance means picking the right stocks”
When an index moves, it’s not because one stock “made the right choice.” It’s because investors repriced expected returns across the constituents, influenced by sector and macro factors. Investors can use index returns to infer market sentiment, but it doesn’t directly reveal individual stock selection skill.
Misunderstanding 3: “All indices are calculated the same way”
They aren’t. Index providers can differ in free-float methodology, reconstitution rules, price versus total return treatment, and corporate action adjustments. If you compare two “China indices” without checking variants, you can compare apples to… apples but with different labels.
Misunderstanding 4: “An ETF will match the index perfectly”
ETFs and funds track but don’t match exactly. Tracking error depends on liquidity, replication style, fees, and operational factors. On top of that, taxes and trading frictions can create consistent gaps.
Knowing these misunderstandings saves time and helps you interpret results more accurately.
Where China Index Coverage Is Headed: Reform, Product Expansion, and Data Quality
China’s index landscape keeps evolving. That evolution is tied to market modernization, better disclosure, and increased availability of index-linked investment products. While it’s hard to predict exact changes, the direction is fairly consistent: more investable products, better tracking, and more refined index methodologies.
As reforms continue, indices may adjust constituent eligibility criteria, float calculations, and sector classification. Investment products can also improve replication techniques, which reduces tracking error. Over time, index data becomes more consistent and more usable for global investors.
One practical implication is that historical backtests may differ from current realities if methodologies shift. For research, always check the latest index fact sheet or methodology description and use consistent definitions for time-series analysis.
Another implication: investors should expect more sector and factor index products tailored to different strategies. If you’ve ever wondered why there are so many “China tech” index products, the answer is demand—some investors want concentrated exposure, others want volatility control or value screens. The indices follow the market participants, and participants respond to what’s investable.
In the end, the indices are not just passive statistics. They’re part of the investment infrastructure. When infrastructure improves, tracking and risk measurement get clearer, which makes index-based investing more practical for a broader set of investors.
Bottom Line: How to Use China Stock Indices Without Overtrusting Them
China stock indices are essential tools, but they’re not magic. They’re rules-based measurement systems that aggregate a chosen set of stocks into a single number. In China, index behavior can differ from what you might expect from a quick global analogy because composition, liquidity, policy influence, and market structure matter.
If you want to use these indices effectively, focus on three things: what the index covers (exchange-based versus composite versus broad coverage), how it’s constructed (weighting, free-float, rebalancing and corporate action adjustments), and how it’s used (funds, ETFs, derivatives, and how product mechanics can create tracking differences).
Do that, and you won’t just watch indices move—you’ll know what the move likely represents, where it can mislead you, and how to choose a benchmark that matches your actual exposure. In markets as fast and policy-linked as China’s, that’s about as close to “not getting surprised” as you’re likely to get.